Description
?
KPMG Past Questions and Answers?
KPMG is a multinational professional services firm. Recognized as one of the Big Four, KPMG provides tax, audit and advisory services worldwide and employs over 200,000 people. Roles at KPMG are highly sought after, and understanding the application process (including the importance of the various assessments) will help you to be more prepared.
KPMG Past Questions and Answers- 2025 Updated, will help you prepare adequately for the test. Revealing all past and recent questions as they appeared in the actual test. There is really not enough time for adequate preparation. This study pack aims at helping you streamline your practice time and ensures you focus on the areas that matter.
KPMG Aptitude Test Format
- Quantitative reasoning section: GMAT style
- Verbal reasoning: Comprehension passage, analogy and sentence completion, etc
- General Knowledge Section: IQ tests and Diagrammatic reasoning
Sample Questions?

Question 1
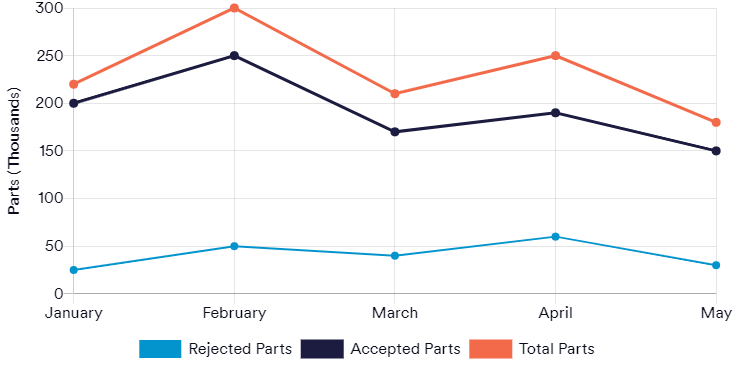
If the number of Accepted Parts produced was 20% lower this May than last May, how many Accepted Parts were produced last May?
A. 167,500
B. 170,500
C. 176,600
D. 187,500
Solution
Step 1 – Calculate what 1% would be if 150,000 is 80%.
150,000 / 80 = 1875
Step 2 – Multiply that by 100 to work out 100%.
1,875 x 100 = 187,500
Therefore last May, 187,500 Accepted Parts were produced (if this year saw a 20% decrease).
Question 2
If Total Parts continued to decrease at the same rate as between April and May, how many would be produced in June?
A. 129,600
B. 128,400
C. 132,200
D. 136,400
Solution
Step 1 – Calculate the actual difference between April and May.
250,000 – 180,000 = 70,000
Step 2 – Work out what 70,000 is as a percentage of 250,000 (April’s Total).
70,000 / 250,000 x 100 = 28%. The Total produced went down by 28%.
Step 3 – Work out what 72% of 180,000 is.
(1-0.28) x 180,000 = 129,600
Question 3
What is the ratio of Rejected Parts to Accepted Parts in February?
A. 1:10
B. 0.2:1
C. 0.5:1
D. 5:1
Solution
Step 1 – Compare number of Rejected Parts to Accepted Parts in February.
50,000 : 250,000
Step 2 – Divide the lowest by the highest.
50,000/250,000 = 0.2
Step 3 – This equates to 0.2 : 1.
Question 4
What was the ‘Total Parts produced’ less ‘Rejected Parts produced’ across and including February to May?
A. 680,000
B. 720,000
C. 760,000
D. 700,000
Solution
Step 1 – Sum the Total Parts for February to May.
300,000 + 210,000 + 250,000 + 180,000 = 940,000
Step 2 – Sum the Rejected Parts for February to May.
50,000 + 40,000 + 60,000 + 30,000 = 180,000
Step 3 – Subtract the Rejected Parts in Step 2 from the Total Parts in Step 1.
940,000 – 180,000 = 760,000
OR YOU CAN SIMPLY SUM THE ‘ACCEPTED PARTS’ FROM FEB TO MAY!

Question 6
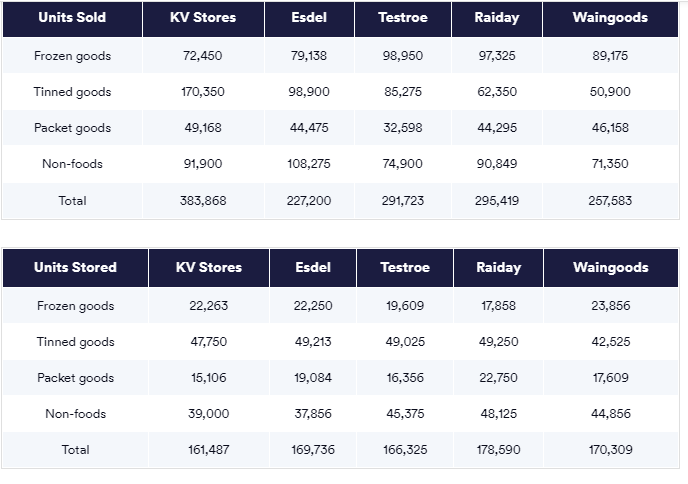
For which of the five stores did Non-foods represent more than 30% of their total Units sold?
A. Ralday and Testroe
B. Esdel and Waingoods
C. Waingoods and KV Stores
D. KV Stores and Testroe
E. Esdel and Ralday
Solution
Step 1 – For each retailer, calculate the % value of the Household sales
KV Stores: (91,900 / 383,868)*100 = 24%
Esdel: (108,275 / 227,200) * 100 = 48%
Testroe: (74,900 / 291,723) * 100 = 26%
Ralday: (90,849 / 295,419) * 100 = 31%
Waingoods: (71,350 / 257,583) * 100 = 28%
Step 2 – Review step 2’s answers to work out which of the figures is greater than 30.
This reveals that only Esdel and Ralday have sold Non-food units that make up more than 30% of the total units sold.
Question 7
The five stores in the table make up 75% of the entire market in terms of Total Units sold. There are two other stores that make up the remaining market share. How many units have the other two stores sold in the same period?
A. 19,411
B. 58,232
C. 194,106
D. 485,264
E. 770,642
Solution
Step 1 – Calculate the Total Units sold for the five stores shown.
383,868 + 227,200 + 291,723 + 295,419 + 257,583 = 1,455,791
Step 2 – If 1,455,791 represents 75% of the Total Units sold, we can use this to calculate the 100% value
1,455,791 / 75 = 19,410.55
19,410.55 x 100 = 1,941,054.67
Step 3 – If 1,941,054.67 represents the total marketplace, we now need to work out the 25% for the stores not shown in the table.
1,941,054.67 x 25% = 485,264
Question 8
Looking at the Units sold for Testroe and Ralday, for which category of goods is there a greater than 20% difference in value?
A. Packet goods and Non-foods
B. Non-foods and Packet goods
C. Tinned goods and Non-foods
D. Tinned goods and Packet goods
E. Packet goods and Frozen goods
Solution
Step 1 – Calculate the % difference in value for each category of Units sold.
Frozen goods = 1% difference
Tinned goods = 27% difference
Packet goods = 26% difference
Non-foods = 18% difference
Step 2 – Review Step 1 to determine which are greater than 20% making the correct answer Tinned goods and Packet foods.

Question 10
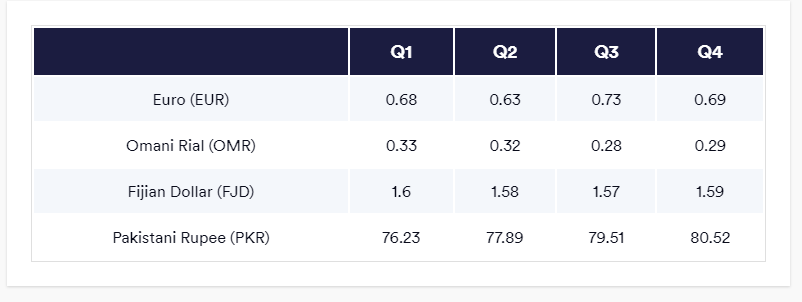
What is the percentage change in the value of the EUR from Q2 to Q4 compared to the CAD?
A. 9.5% decrease
B. 8.7% decrease
C. 6.0% decrease
D. 8.5% increase
E. 10.5% increase
Solution
Step 1 – From the table you can see that 1 CAD will buy you more EUR in Q4 than Q2. This shows that the value of the EUR has decreased in value. Calculate the percentage change.
((0.69 – 0.63) / 0.63) x 100 = 9.5% decrease
Question 11
OMR 750 was used to buy CAD in Q1 and then converted back to OMR in Q4. How many OMR did this buy?
A. 589
B. 659
C. 712
D. 789
E. 815
Solution
Step 1 – Calculate how many CAD you can buy with OMR 750 in Q1.
OMR 750 / 0.33 = 2,272.73
Step 2 – Calculate how many OMR you can buy with CAD in Q4.
2,272.73 x 0.29 = 659.09
Question 12
Which currency depreciated the most in value against the CAD between Q1 and Q4?
A. Euro
B. Omani Rial
C. Fijian Dollar
D. Pakistani Rupee
E. Cannot tell
Solution
Step 1 – Calculate the percentage change in the value of each currency between Q1 and Q4.
EUR (0.69 – 0.68) / 0.68 x 100 = 1.5%
OMR (0.29 – 0.33) / 0.33 x 100 = -12.1%
FJD (1.59 – 1.6) / 1.6 = -0.6%
PKR (80.52 – 76.23) / 76.23 = 5.6%
One Canadian dollar would buy you 80.52 PKR in Q4 versus 76.23 in Q1.


